When you look at a crypto chart, you’re not just seeing lines and bars-you’re reading the story of thousands of traders making split-second decisions driven by fear, greed, and momentum. Candlestick patterns turn that chaos into something you can learn, recognize, and trade with confidence. Unlike simple line charts, candlesticks show you exactly how price moved during a specific time window: where it opened, where it peaked, where it hit bottom, and where it closed. In crypto markets, where prices can swing 20% in an hour, that detail isn’t just useful-it’s essential.
What a Candlestick Actually Shows
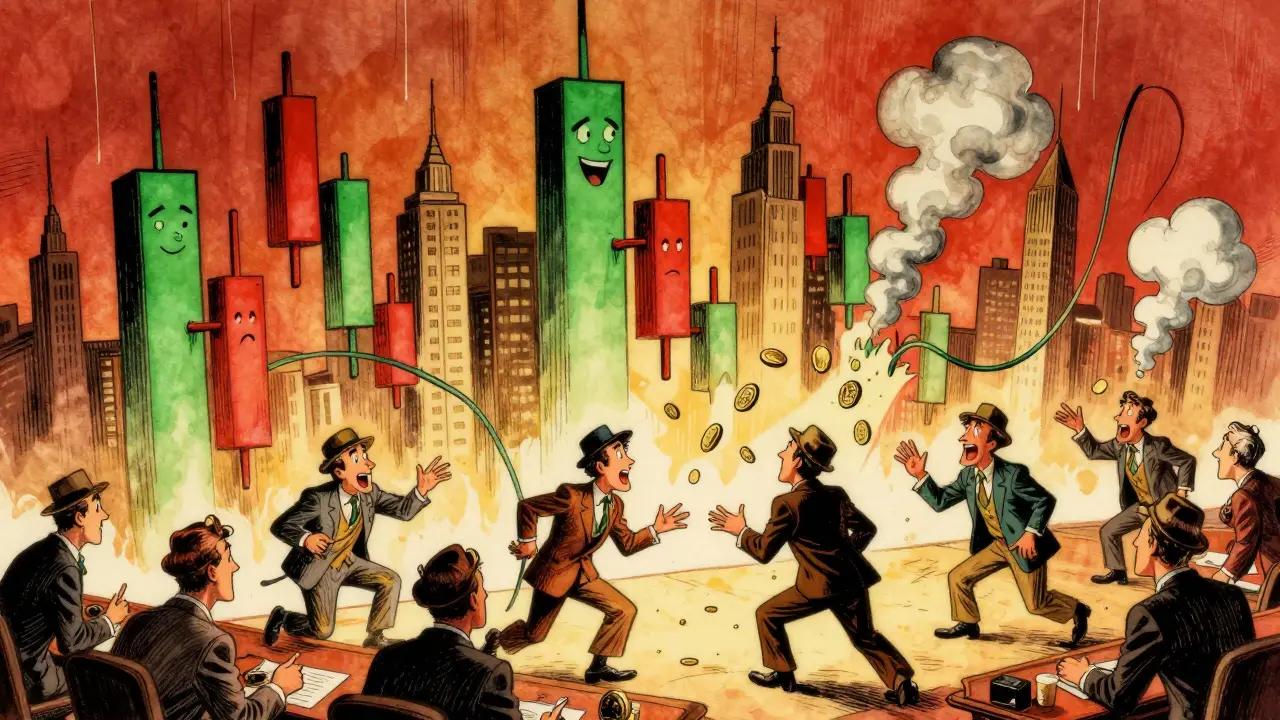
Each candlestick is made of two parts: the body and the wicks (also called shadows). The body shows the difference between the opening and closing price. If the body is green, the price closed higher than it opened-buyers won that period. If it’s red, the price closed lower-sellers took control. The wicks stretch above and below the body, showing the highest and lowest prices reached during that time. A long upper wick means buyers pushed price up but got rejected. A long lower wick means sellers drove it down, but buyers stepped in and pulled it back. In crypto, there’s no 9-to-5 market. A daily candle doesn’t start at 9:30 a.m. and end at 4 p.m. It starts at midnight UTC and ends at the next midnight. That’s important because major news, like a Bitcoin ETF approval or a Coinbase listing, often drops during Asian or European hours. Your candlesticks reflect real-time market action, not artificial market hours.Reversal Patterns: When the Tide Turns
These are the patterns traders watch for when they think a trend might flip. They don’t guarantee a reversal-but they give you a strong signal to pay attention.- Bullish Engulfing: A small red candle is followed by a larger green candle that completely covers the body of the first one. This means buyers came in strong after sellers had control. It often shows up after a drop and signals a potential bounce. In Bitcoin’s 2024 rally, this pattern appeared multiple times on 4-hour charts right before price jumped $5,000+.
- Bearish Engulfing: The opposite. A small green candle is followed by a large red candle that swallows it whole. This happened in Ethereum right after its spot ETF approval hype peaked in late 2023. Traders who saw it and exited long positions avoided a 15% drop over the next 48 hours.
- Shooting Star: Looks like a candle with a tiny body at the bottom and a long upper wick. It forms after a price rise and shows buyers pushed hard but got crushed by sellers. Common in altcoin pumps that fade fast.
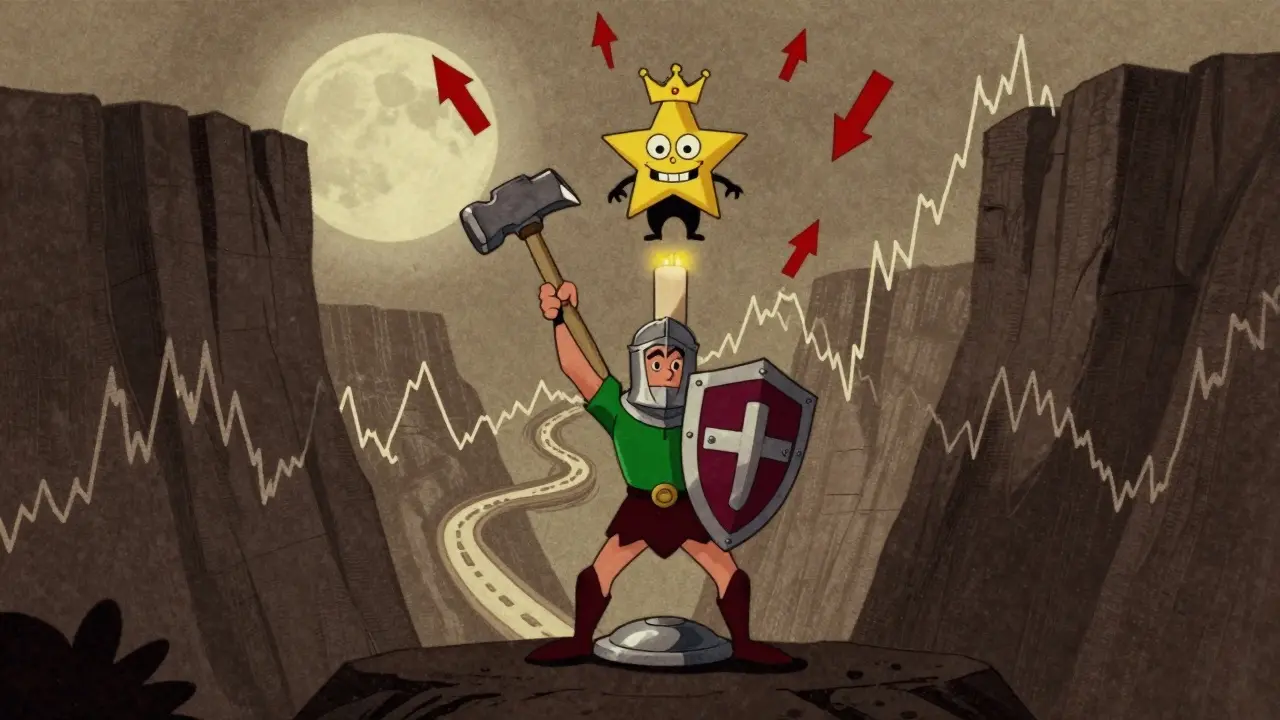
- Hammer: Similar shape to the shooting star but appears after a drop. A small body at the top of a long lower wick. It says: sellers tried to kill the price, but buyers fought back. Often a sign of a bottom.
Continuation Patterns: The Pause Before the Next Move
Not every pattern means a reversal. Sometimes the market is just catching its breath.- Doji: This is the quiet one. The opening and closing prices are almost the same, so the body is a thin line or just a dot. The wicks can be long or short. A doji means neither buyers nor sellers could gain control. Alone, it’s neutral. But if it shows up after a long uptrend, it’s a warning. After a long downtrend, it’s a clue that the bottom might be near.
- Spinning Top: Like a doji, but with a slightly larger body. The wicks are roughly equal in length. It’s indecision on steroids. In crypto, you’ll see this after big news-like when a major exchange announces a new listing. Price doesn’t move much, but everyone’s waiting to see what happens next.
- Three White Soldiers: Three long green candles, each opening within the body of the previous one and closing near its high. It’s a strong sign of sustained buying pressure. Seen in Bitcoin’s 2024 rally after the ETF news. Traders who entered on the third candle caught the next 30% surge.
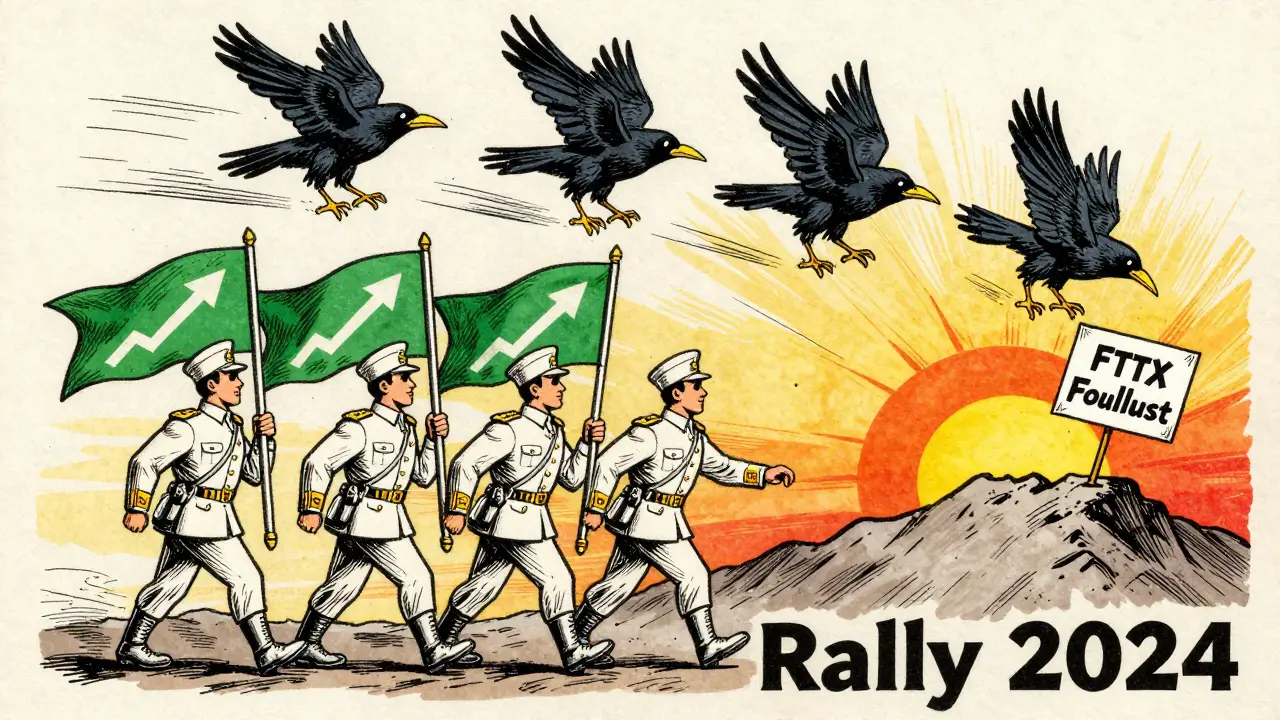
- Three Black Crows: The bearish version. Three long red candles, each opening within the previous candle’s body and closing near its low. It’s a sign sellers are in full control. This pattern showed up in Solana’s 2023 crash after the FTX fallout.
Advanced Patterns: Beyond the Basics
Once you’re comfortable with the basics, you’ll start seeing more complex formations. These aren’t as common, but when they appear, they’re powerful.- Dark Cloud Cover: A green candle is followed by a red candle that opens above the green’s high but closes below its midpoint. It’s not just a reversal-it’s a psychological shift. Buyers thought they were safe. Sellers showed up and smashed the momentum. This pattern was clear on Bitcoin’s weekly chart in January 2024, right before the $42K pullback.
- Falling Three Methods: A long red candle, then three small green candles that don’t reverse the trend, then another long red candle. It looks like buyers tried to rally, but sellers crushed them. This pattern often signals the continuation of a downtrend. It’s common in altcoins after their initial pump.
- Bearish Mat Hold: A big red candle, then three small green candles (like a pause), then another big red candle that breaks below the first one. It’s a trap. Traders think the downtrend is over, but sellers come back with force. Seen often in meme coins after influencer hype dies.
Why Crypto Candlesticks Are Different
Crypto isn’t just a faster version of stocks. It’s a different beast.- 24/7 trading: No weekends, no holidays. That means patterns can form faster. A doji on a 15-minute chart might mean something very different than one on a daily chart.
- Extreme volatility: A single tweet from Elon Musk can create a 20% candle. That means false signals are more common. A bullish engulfing pattern might look perfect-but if it happens right before a regulatory announcement, it could be meaningless.
- Leverage: Most crypto traders use leverage. When the market moves against a big position, it triggers forced liquidations. That can cause wild spikes or crashes that have nothing to do with the candlestick pattern itself. A “bullish breakout” might just be a short squeeze.
- Social media influence: Reddit, Twitter, and Telegram can move markets faster than any chart. A pattern might form, but if a popular influencer says “sell,” the whole thing can collapse before the next candle closes.
How to Trade Candlestick Patterns Effectively
Seeing a pattern isn’t enough. You need a plan.- Confirm the trend: Is the pattern forming after a strong move? A bullish engulfing after a 30% drop is more reliable than one after a 5% bounce.
- Check volume: A breakout candle with high volume is stronger than one with low volume. In crypto, volume spikes often confirm real interest. Use a volume indicator alongside your chart.
- Wait for the close: Never trade on a candle that’s still forming. Wait until the time period ends. A green candle that looks like a hammer at 10:58 a.m. might turn red by 11:00 a.m.
- Set stop-losses: If you’re trading a bullish engulfing, place your stop-loss just below the low of the pattern. If you’re trading a bearish engulfing, place it just above the high.
- Combine with other tools: Use RSI to check if the market is overbought or oversold. Use moving averages to confirm the trend. Look at on-chain data like exchange outflows or whale movements. Candlesticks are just one piece of the puzzle.
Common Mistakes to Avoid
- Chasing patterns: Don’t buy a hammer just because it looks like one. If the overall market is crashing and Bitcoin is down 12% in a week, that hammer might be a trap.
- Ignoring context: A doji on a 1-minute chart means nothing. On a weekly chart, it’s a major signal. Always match the pattern to the timeframe you’re trading.
- Overtrading: You don’t need to trade every pattern. Wait for high-probability setups. In crypto, fewer trades with higher confidence win more than 10 trades a day.
- Forgetting fundamentals: A perfect bullish engulfing won’t save you if the coin’s team just got indicted or the protocol’s TVL is collapsing.
Final Thoughts: Patterns Are Tools, Not Crystals
Candlestick patterns won’t tell you exactly when to buy or sell. But they will tell you where the market’s emotional temperature is changing. In crypto, where sentiment swings faster than a rollercoaster, understanding those shifts gives you an edge. The best traders don’t rely on patterns alone. They use them with volume, trendlines, and real-world events. They wait for confirmation. They manage risk. And they know that in a market that never sleeps, patience is the most powerful pattern of all.Are candlestick patterns reliable in crypto markets?
Candlestick patterns work in crypto, but they’re less reliable than in traditional markets because of extreme volatility, leverage, and social media influence. A pattern that looks perfect on paper can be wiped out by a single tweet or regulatory announcement. Always combine them with volume, trend confirmation, and fundamental context to improve accuracy.
Which timeframe is best for trading candlestick patterns in crypto?
It depends on your strategy. Day traders use 15-minute to 4-hour charts. Swing traders prefer 4-hour and daily charts. Weekly charts are best for spotting major reversals. Avoid trading on 1-minute charts unless you’re scalping-noise overwhelms real signals. Most successful crypto traders focus on 4-hour and daily patterns for balance between signal clarity and frequency.
Can I use candlestick patterns with automated trading bots?
Yes, but with caution. Many bots are programmed to detect patterns like engulfing candles or dojis. However, in crypto, false signals are common due to sudden news or liquidations. Bots that only rely on candlesticks without volume filters or trend confirmation often lose money. The best bots combine candlestick triggers with on-chain data and moving averages to reduce false entries.
Do candlestick patterns work better on Bitcoin or altcoins?
They work better on Bitcoin because it has higher liquidity and less manipulation. Altcoins are more prone to pump-and-dump schemes, where patterns are artificially created by whales. A bullish engulfing on Solana might be a trap if it’s followed by a coordinated sell-off. Bitcoin’s patterns are more reflective of real market sentiment, especially after institutional adoption grew in 2023-2024.
What’s the most powerful candlestick pattern in crypto?
There’s no single “most powerful” pattern, but the bullish and bearish engulfing patterns are the most reliable for reversals in crypto. They clearly show a shift in control between buyers and sellers. When they appear on daily or weekly charts with high volume, they often precede major moves. In 2024, Bitcoin’s breakout above $40K was preceded by a strong bullish engulfing on the daily chart, followed by a volume spike.


Comments (22)
Jessie X
candlesticks are just vibes man. i dont even look at the bodies anymore just the wicks. if theres a long top wick after a pump its already dead. no math needed.
Danyelle Ostrye
i used to chase every engulfing pattern like it was a lottery ticket. then i lost 3k in one week on a fake bullish hammer during a fed announcement. now i wait for volume + onchain outflows. candlesticks are just the first filter.
Kip Metcalf
this is solid. i love how you broke down the difference between crypto and stocks. no weekend breaks means your patterns are always cooking. just dont forget to check if the whale wallets are moving before you go all in.
Natalie Kershaw
youre speaking my language. the three white soldiers on btc daily in january? pure fire. i waited for the close, checked the volume spike on binance, and hit my buy order. 30% in 72 hours. candlesticks + volume = magic. dont overcomplicate it.
Mujibur Rahman
in crypto the doji is king. its the market holding its breath. but you gotta pair it with the 200ema. if the doji forms below the 200 on a 4h chart its a bear trap. above it? thats the real deal. also dont forget liquidity zones. patterns mean nothing if no one's there to fill the orders
Dennis Mbuthia
you people are delusional. candlesticks are for beginners who think charts predict the future. the market is manipulated by whales, exchanges, and hedge funds. a hammer is just a stop hunt. a bullish engulfing? that’s just a short squeeze. you’re all gambling with fairy tales. if you want real edge, trade the news and the fed. not some colored rectangles.
Sherry Giles
you think these patterns are real? they’re programmed. the algos know you’re looking for engulfing candles so they create fake ones to trigger your stop losses. then they reverse. it’s all a trap. the government and big banks control the blockchain. your candlesticks are just a distraction from the real game: surveillance and manipulation.
Krista Hoefle
candlesticks? lol. i trade memecoins. i dont need patterns. i just follow the tg group with the most caps lock and emojis. last week i bought a coin called 'daddy coin' because someone said 'it gon moon'. made 8x. your charts are so last year.
Emily Hipps
you got this! candlesticks are your superpower if you use them right. dont get discouraged by the naysayers. every pro started where you are. keep studying, keep journaling your trades, and trust the process. you’re gonna crush this!
Jon Martín
the shooting star on solana last month? that was a death sentence. i saw it at 2am, felt it in my bones, and got out before the 40% dump. candlesticks are not just data theyre energy. you feel the shift. the market whispers and you better listen
Jennah Grant
the three black crows pattern on solana was textbook. but what made it lethal was the concurrent drop in github commits and the exodus from their treasury wallet. patterns are only as strong as the fundamentals behind them. always cross-reference.
Staci Armezzani
i teach this to my students every week. the key is context. a hammer on a 15m chart during a 10% downtrend is noise. a hammer on a daily chart after a 30% drop with rising volume? that’s your signal. pair it with the rsi below 30 and you’ve got a high-probability setup. simple, but most miss it.
Brittany Slick
i love how candlesticks feel like little emotional snapshots. that little red body with a long tail? that’s the market screaming ‘i’m scared but i’m not giving up’. it’s poetry. not math. it’s the soul of the crowd speaking in price. i dont trade i feel.
greg greg
i’ve been backtesting candlestick patterns on 5 years of btc data and found something interesting. the bullish engulfing works best when it occurs after at least three consecutive red candles with decreasing volume, followed by a volume spike on the engulfing candle. the success rate jumps from 58% to 76% under those conditions. also, the pattern is significantly less reliable on altcoins with market cap under $500m. anyone else see this?
Andy Schichter
oh wow. another guy who thinks charts are magic. next you’ll tell me the moon phase affects your trades. candlesticks? that’s like reading tea leaves while standing in a hurricane. the only thing that matters is who’s holding the keys to the liquidity pool. you’re all just rearranging deck chairs on the titanic.
Caitlin Colwell
i just read this. felt calm. thanks.
Denise Paiva
The utilization of candlestick patterns as predictive indicators within decentralized digital asset markets is, in my estimation, a fundamentally flawed epistemological approach. The stochastic nature of liquidity provision, coupled with algorithmic front-running, renders such technical constructs statistically insignificant. One ought to instead focus on protocol tokenomics and governance participation metrics.
Charlotte Parker
candlesticks are just a placebo for people who need to believe they control something that’s completely random. you think you’re reading the market? you’re just seeing patterns your brain made up to feel less anxious. the truth? the market doesn’t care. it’s just code and greed. you’re not a trader. you’re a storyteller with a chart open.
Calen Adams
bro this is fire. i use the engulfing patterns with the 50ema cross on 4h. when they align? i go all in. last week i caught a 25% pop on avalanche with this exact setup. volume was up 300%. candlesticks + ema = unstoppable combo. dont sleep on it.
Valencia Adell
you missed the point. candlesticks are irrelevant. the real edge is in liquidation heatmaps and funding rates. every bullish engulfing you see is preceded by a $200m short liquidation. the pattern is a symptom, not the cause. track the money flow, not the colors.
Sarbjit Nahl
in india we call this technical astrology. the market moves because humans are irrational. patterns are just stories we tell ourselves to feel smart. if you want to trade crypto, learn behavioral economics. not candlesticks. the only reliable signal is panic or euphoria. everything else is noise.
Paul Johnson
you think you know something? i’ve been trading since 2017 and i know one thing: everyone who follows candlesticks loses money. you dont see the big players pulling the strings. they create fake patterns to trap you. then they dump. you think you’re trading? you’re just feeding the machine. stop being a sheep.