On-Chain Metric Signal Checker
Enter values and click "Analyze Market Signals" to see detailed analysis.
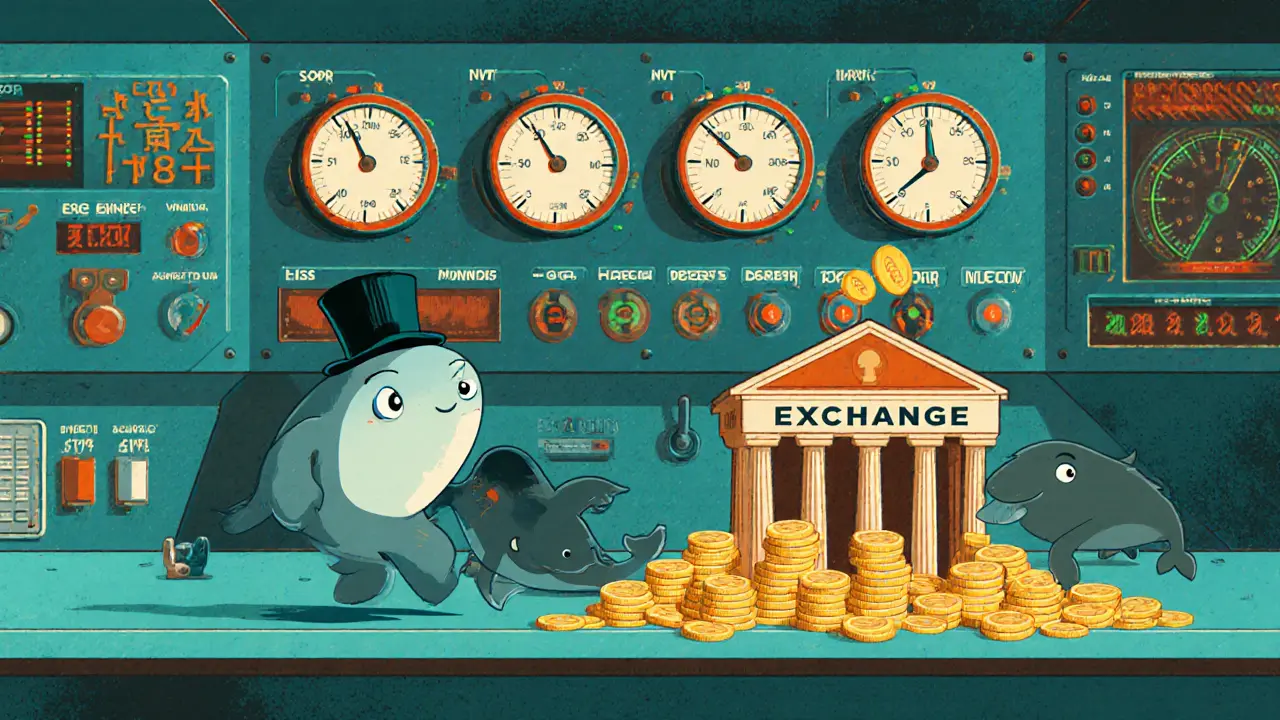
SOPR Analysis
Measures profitability of coins being spent. Values above 1.0 indicate profit-taking.
NVT Analysis
Compares network value to transaction volume. High values may suggest overvaluation.
Active Addresses
Tracks daily unique senders/receivers. Rising numbers indicate growing adoption.
Exchange Flow
Net movement of funds to/from centralized exchanges. Can indicate accumulation or distribution.
Investors and analysts keep hearing about On-Chain Analysis as the secret sauce behind many crypto market calls. In reality, it’s just a way to read the raw data that every blockchain publishes for free. This guide breaks down what on‑chain analysis is, which metrics matter, which tools you can use, and how to avoid the common traps that trip up beginners.
Key Takeaways
- On‑chain analysis examines public blockchain data to reveal real‑time market behavior.
- Core metrics such as Active Addresses, SOPR, NVT, and MVRV provide signals about demand, profit taking, and valuation.
- Leading platforms (Glassnode, Nansen, Arkham) turn raw data into ready‑to‑use dashboards, but free explorers can get you started.
- Combining on‑chain metrics with technical analysis boosts prediction accuracy by 10‑15% on average.
- Watch out for off‑chain activity, data latency, and mis‑interpreted exchange flows.
What Is On‑Chain Analysis?
On-Chain Analysis the systematic examination of blockchain data to extract market‑relevant insights leverages the fact that blockchains are public, immutable ledgers. Every transaction, wallet address, and contract call is recorded permanently, though the identities behind the addresses stay anonymous. By aggregating this raw data, analysts can infer who is buying, who is selling, and where large holders (often called "whales") are moving funds.
How On‑Chain Metrics Are Calculated
Metrics start with basic blockchain elements - transaction hashes, timestamps, amounts, and address labels. These are then transformed into higher‑level indicators. For example, the Spent Output Profit Ratio (SOPR) divides the price at which a coin is spent by the price at which it was last moved. A SOPR above 1.0 means coins are being sold at a profit; below 1.0 signals loss‑realization.
Another classic is the Network Value to Transactions (NVT) ratio, which divides the total market cap (network value) by the daily transaction volume in USD. High NVT values (>100) suggest the network may be over‑valued relative to on‑chain activity.
All calculations rely on clean, timely data feeds. Platforms like Glassnode process over 2.5million transactions per minute to keep their metrics as fresh as 15seconds for major chains.

Core Metrics You Should Know
Below are the most widely tracked on‑chain indicators and what they tell you about market dynamics.
| Metric | What It Measures | Typical Bullish Signal | Typical Bearish Signal |
|---|---|---|---|
| SOPR Spent Output Profit Ratio | Profitability of coins being spent | Values consistently >1.0 | Values <1.0 for several days |
| NVT Network Value to Transactions ratio | Market cap relative to transaction volume | NVT dropping below 80 | NVT climbing above 100 |
| MVRV Market Value to Realized Value ratio | Disparity between current price and average entry price | MVRV >1.0 and rising | MVRV peaking above 4.0 then falling |
Other useful signals include Active Addresses (daily unique senders/receivers), Exchange Net Position Change (net inflow/outflow to centralized exchanges), and Whale movements (large‑scale transfers between wallets).
Tools and Platforms for On‑Chain Analysis
Getting raw data from a blockchain explorer is free but labor‑intensive. Most analysts subscribe to dedicated platforms that package metrics into charts and alerts.
- Glassnode provides real‑time on‑chain data for Bitcoin, Ethereum and dozens of altcoins - Essentials plan starts at $79/month.
- Nansen adds wallet‑labeling to on‑chain data, identifying entities like exchanges, DeFi protocols, and known investors - Starter tier $99/month.
- Arkham Intelligence focuses on entity‑based analytics across 12 major blockchains - Basic plan $149/month.
- Free options: Etherscan (Ethereum), Blockstream Explorer (Bitcoin), BscScan (BNB Chain).
Most platforms also offer API access, allowing you to blend on‑chain metrics with your own trading bots or dashboards.
On‑Chain vs. Other Analysis Methods
Technical analysis (TA) looks at price and volume charts, while fundamental analysis (FA) evaluates project teams, tokenomics, and news. On‑chain analysis sits in the middle: it uses objective, quantifiable data that reflects actual economic activity on the network.
Studies show TA alone predicts short‑term moves correctly about 55% of the time. Adding on‑chain signals pushes accuracy into the high‑60s, according to a 2024 comparative analysis by Arbismart. The key advantage is visibility into “who” is moving funds - something price charts can’t reveal.
However, on‑chain data has blind spots. Roughly 15‑20% of total crypto activity occurs off‑chain (e.g., custodial ledger moves, derivatives). During low‑liquidity periods, metrics can generate false alarms, especially if exchange inflows represent institutional accumulation via OTC desks rather than retail selling.

Practical Tips for Using On‑Chain Data
- Start with a simple signal set: Exchange Net Position Change + Active Addresses. When net inflows rise while active addresses fall, consider a potential price dip.
- Combine profitability and valuation metrics. For example, a SOPR >1.2 together with a decreasing NVT often precedes a short‑term rally.
- Watch whale movements on a “whale‑watchlist.” Large transfers (>1,000BTC) to exchanges have historically preceded price drops 78% of the time (Coinbase data 2021‑2023).
- Use time‑weighted averages. A single day spike can be noise; look at 7‑day moving averages for smoother signals.
- Cross‑check with off‑chain data where possible - e.g., futures open interest or order‑book depth - to confirm on‑chain signals.
Common Pitfalls and How to Avoid Them
Even seasoned traders misinterpret on‑chain metrics. The most frequent errors include:
- Assuming every exchange inflow is bearish. Sometimes large inflows flag institutional buying via OTC desks. Check the source address label (Nansen can help).
- Relying on a single metric. SOPR alone can be misleading if the market is highly leveraged.
- Neglecting data latency. Free tiers often lag by an hour, which can erase the edge in fast markets.
- Over‑paying for tools without understanding the basics. Many retail users find the $99/month price prohibitive; start with free explorers before upgrading.
By triangulating multiple indicators and staying aware of the data’s limitations, you reduce false signals dramatically - Glassnode estimates a 41% reduction when pairing Exchange Net Position Change with SOPR.
Future Trends in On‑Chain Analytics
The on‑chain analytics market is booming, projected to hit $1.2billion by 2028. Upcoming developments promise even richer insights:
- AI‑driven prediction engines (e.g., Nansen Alpha) that analyze dozens of metrics simultaneously, already achieving ~68% 24‑hour price‑movement accuracy.
- Cross‑chain tracking - platforms like Chainalysis’s PolyScope will let analysts follow assets as they hop between Ethereum, Solana, and newer L2s.
- Integration of off‑chain data (derivatives, order books) to create hybrid models aimed at 80%+ prediction accuracy by 2026.
- Improved wallet‑labeling, reducing the “unknown address” problem from 40% to under 10% as more entities share on‑chain footprints.
Staying updated on these innovations ensures you keep a competitive edge as the field matures.
Frequently Asked Questions
What data sources do on‑chain analysis tools use?
They pull directly from blockchain nodes or public APIs that expose raw transaction data, wallet balances, and smart‑contract events. Platforms may also enrich this data with third‑party labeling services.
Can on‑chain analysis predict price movements?
It can improve prediction odds, especially when paired with technical analysis. Historical studies show combined models boost accuracy to around 70% for short‑term moves.
Do I need expensive software to start?
No. Free block explorers like Etherscan let you track basic metrics. Subscription tools become valuable once you need real‑time alerts, advanced labeling, or API access.
How reliable are exchange flow data?
Generally reliable, but about 12% can be skewed by non‑custodial wallets or internal exchange transfers. Cross‑checking multiple exchanges reduces the risk.
Is on‑chain analysis suitable for retail traders?
Yes, if you start with a simple metric set and avoid over‑paying for premium tiers. Many retail users see better risk‑adjusted returns by adding exchange flow and active address signals.


Comments (7)
Serena Dean
On-chain analysis is honestly a game changer if you know how to use it right. I started with Etherscan and just tracked active addresses and exchange inflows - no fancy tools needed. Once I saw a spike in inflows while active addresses dropped, I waited a few days and caught a 15% dip before the rally. It’s not magic, but it’s way better than just staring at candlesticks.
Start simple. Don’t get sucked into paying $100/month right away. Free tools give you 80% of the insight if you’re patient.
Michael Folorunsho
Pathetic. You people treat on-chain data like some sacred oracle when it’s just glorified spreadsheet math. Blockchain data is public because it’s designed to be manipulated - wash trading, fake wallets, layered transactions. The so-called ‘whale movements’? Half of them are exchange internal transfers masked as external. Glassnode and Nansen are just marketing machines selling delusions to retail sheep.
Real traders use order flow and liquidity zones. This on-chain nonsense is for people who need to feel smart without actually learning price action.
Sean Huang
you think theyre showing you the truth but its all staged... the blockchains are not decentralized at all... the nodes are controlled by a few big firms who feed the data to glassnode and nansen to manipulate the signals... they want you to sell when theyre accumulating... they want you to buy when theyre dumping... its all a psyop... the 15 second data updates? fake... its delayed by 3 hours and then backfilled to make it look real... theyre using your fear and greed to feed the whales... dont trust the charts... trust the silence... the silence is where the truth hides...
they dont want you to know that 80% of btc is held by 2% of wallets... and those wallets are not even on chain... theyre in off chain vaults controlled by the fed and the bank of international settlements... the whole thing is a digital gold standard... designed to replace cash... and you're helping them by chasing these metrics... wake up
Ali Korkor
Bro this is so dope. I was lost until I started watching exchange net position change. When BTC starts piling into exchanges and active addresses drop? That’s your clue to step back. I used to chase pumps, now I wait for the dip after the inflow spike. Took me 3 months but now I’m up 40% this year just using free tools.
Don’t overthink it. One metric at a time. You don’t need to buy everything. Just watch. Wait. Then act.
madhu belavadi
i hate this stuff... why do people make it so complicated... i just want to buy low and sell high... why do i need to know about sopr or mvrv... its just noise... every time i look at these charts i feel stupid... and then i lose money... why cant they just say when to buy and when to sell... why does everything have to be so deep... i just want to make money without reading a textbook
Dick Lane
man i read this whole thing and i felt like someone finally explained it without making me feel dumb
i used to think on chain stuff was for hedge funds but now i get it... its just watching where the money moves... like seeing who leaves the party early
thanks for writing this. i printed it out and put it on my fridge. i dont have to remember all the metrics. just remember: if whales are moving and regular people are quiet... something’s coming
Norman Woo
they say its free data but its not... they track your ip when you use etherscan... they know your wallet... they know what you look at... then they pump the price just to see you buy... then dump... its all rigged... and the tools? theyre planted by the cia to control crypto... i use tor and a vpn and only look at raw node data... no dashboards... no labels... just raw hashes... they cant fool me... i see the truth in the bytes... they dont want you to know this... but now you do