When you buy Bitcoin and Ethereum at the same time, are you really diversifying your portfolio? Or are you just doubling down on the same risk? The answer lies in something called correlation-a simple but powerful number that tells you how two cryptocurrencies move in relation to each other. If Bitcoin goes up and Ethereum follows right behind, their correlation is high. If one rises while the other falls, they’re negatively correlated. And if they move completely independently? That’s zero correlation. Understanding this isn’t just for math nerds-it’s critical for anyone holding more than one crypto asset.
What Does Correlation Actually Mean?
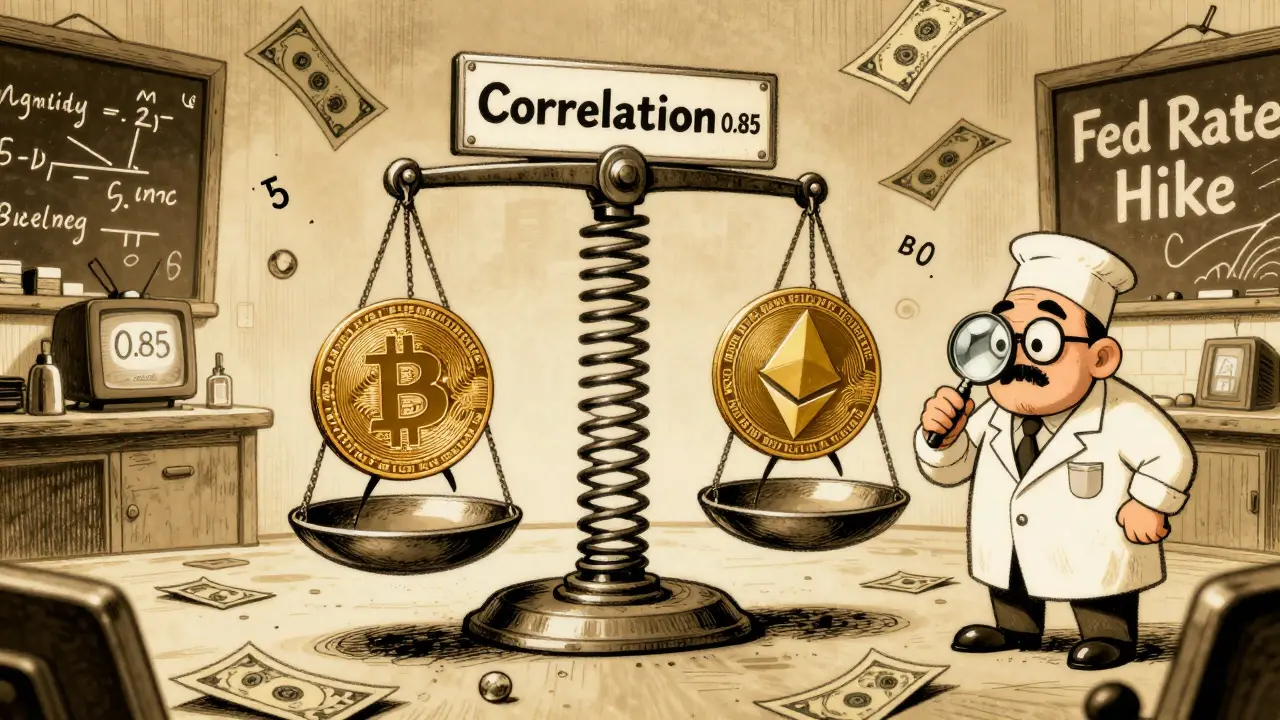
Correlation is measured on a scale from -1 to +1. A value of +1 means two assets move in perfect sync-when one goes up, the other goes up by the same amount. A -1 means they move in opposite directions. A 0 means no relationship at all. Most of the time, crypto pairs hover between 0.5 and 0.9, which means they’re strongly linked but not identical. For example, as of early 2025, Bitcoin and Ethereum had a 24-hour correlation of about 0.85. That’s high. It means if Bitcoin jumps 5%, Ethereum is very likely to jump 4-5% too. But over a six-month window, that number climbed to 0.91. Why? Because during periods of market stress-like Fed rate hikes or major exchange outages-investors sell everything at once. The market doesn’t care if it’s Bitcoin or Dogecoin; it’s all crypto, and it all gets dumped together.How Is Correlation Measured?
The most common method is the Pearson Correlation Coefficient. It’s used in finance because it’s straightforward: it measures how closely two price series move in a straight line. If you plot Bitcoin’s daily prices against Ethereum’s and draw a line through the dots, Pearson tells you how tightly those dots hug that line. But there are other methods. Spearman looks at rankings instead of exact values. So even if the price movements aren’t perfectly linear, if one asset consistently ranks higher than the other over time, Spearman catches that. Kendall’s Tau is similar but better for smaller datasets or noisy data. Most retail investors stick with Pearson because it’s built into Excel, Google Sheets, and free Python libraries like pandas. Professional traders use more advanced tools. The DCC-GARCH model, for instance, doesn’t just look at past data-it adjusts its correlation estimate in real time based on recent volatility. During the 2022 crypto crash, this model showed correlations spiking to 0.95, then falling back to 0.75 as markets stabilized. That’s the kind of insight you can’t get from a static spreadsheet.Correlation Isn’t Static-It Changes With the Market
One of the biggest mistakes investors make is assuming correlation stays the same. It doesn’t. Think of it like weather: sunny days and rainy days aren’t random-they follow patterns. So do crypto correlations. During the COVID-19 panic in March 2020, nearly every cryptocurrency dropped 50% or more in a week. Correlation between Bitcoin, Solana, Cardano, and even meme coins like Shiba Inu jumped above 0.9. Everyone was panicking, so everything fell together. Fast forward to late 2023, after the Bitcoin ETF approvals. Correlations dropped. Bitcoin moved on macro news-interest rates, inflation data-while Ethereum surged on Layer 2 adoption and staking yield trends. Solana spiked on DeFi volume. Dogecoin reacted to Elon Musk tweets. Suddenly, diversification worked again. The correlation between Bitcoin and Ethereum fell from 0.90 to 0.68 in just three months. This is why looking at a single correlation number is useless. You need to track it over time. A 0.7 correlation today might be 0.95 next month. That’s not a glitch-it’s the market adapting.
Correlation With Traditional Assets
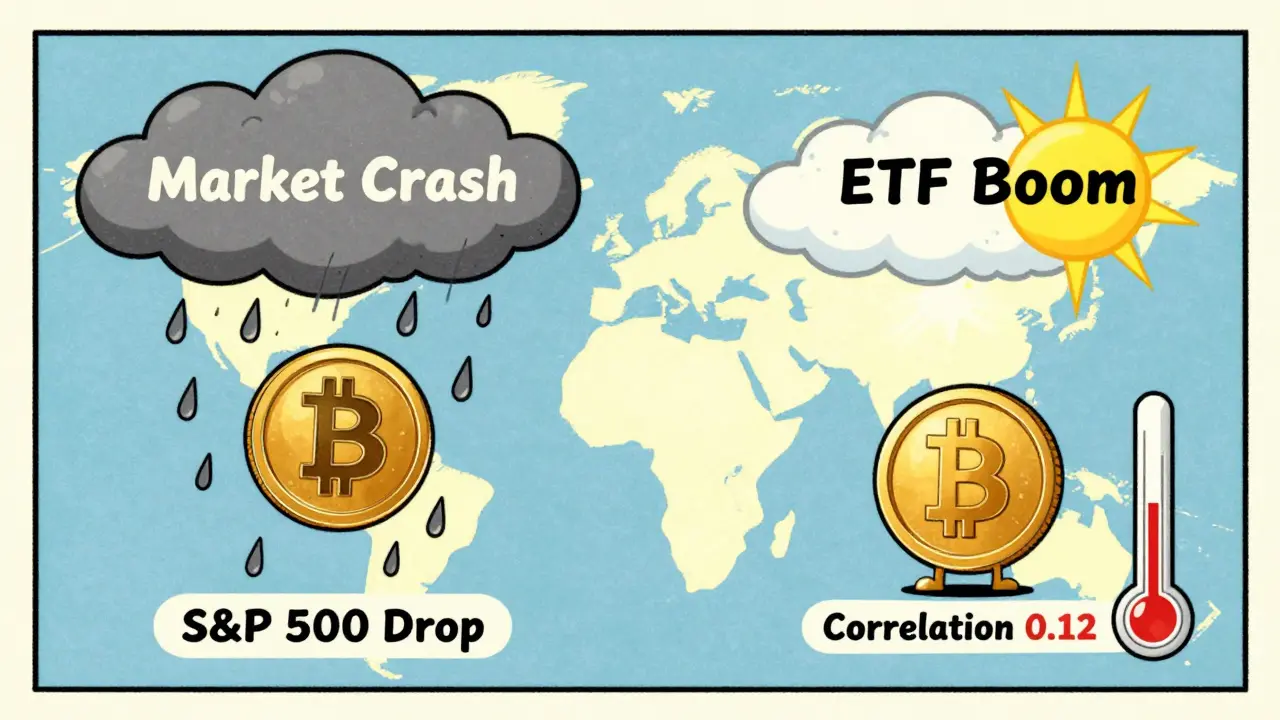
A lot of people think crypto is a hedge against stocks. It’s not-at least not yet. In 2024, Bitcoin’s correlation with the S&P 500 hit 0.65, its highest level in five years. That means when stocks dropped, crypto dropped too. Same with growth-focused ETFs like ARKK. The correlation between Bitcoin and small-cap growth funds was 0.41, compared to 0.35 for value funds. Not huge, but enough to matter. Gold, on the other hand, stayed mostly uncorrelated. Over a two-year period, Bitcoin and gold had a correlation of just 0.12. That’s why some investors now treat gold and Bitcoin as separate hedges-one for inflation, one for tech-driven scarcity. The takeaway? Don’t assume crypto is a safe haven. It’s still a risk asset. If your portfolio is 70% stocks and 30% crypto, you’re not diversified-you’re just more exposed to tech and growth trends.How to Use Correlation in Your Portfolio
Here’s how to make this useful:- Check your holdings: If you own 5 cryptos and they all have correlations above 0.8, you’re not diversified-you’re overexposed. You need at least one asset with a correlation below 0.5.
- Use correlation heatmaps: Tools like CoinGecko and TradingView let you generate correlation matrices. Look for outliers-like a coin that moves opposite to the rest. That’s your diversification candidate.
- Watch for drops: When correlation between your assets falls, that’s a signal to rebalance. Maybe add more of the lagging asset.
- Avoid the “everything goes up” trap: During bull runs, everything rises. That makes correlation seem low, but it’s fake diversification. Wait for a downturn to see who really holds up.
Tools to Measure Correlation Yourself
You don’t need a hedge fund to do this. Here’s what works:- Excel or Google Sheets: Use the
CORREL()function. Just paste in two columns of daily prices (from CoinGecko or CoinMarketCap) and it spits out the number. - Python: With pandas and yfinance, you can pull data and generate a full correlation matrix in 10 lines of code.
- TradingView: Type “correlation matrix” in the indicator search. It auto-generates a heatmap for 10+ cryptos.
- Bloomberg Terminal: If you have access (rare for retail), use the
CRPfunction to compare crypto against stocks, bonds, and commodities.
Why This Matters More Than You Think
Crypto is no longer a fringe experiment. It’s part of the global financial system. And like any system, it’s governed by patterns. Correlation is one of the most reliable ones. If you treat all cryptocurrencies as the same, you’ll get burned. If you assume they’re all independent, you’ll miss opportunities. The truth is in between: some move together, some don’t. And that changes constantly. The smartest investors don’t just buy what’s trending. They look at the numbers. They ask: Are these assets really different? Or are they just the same thing wearing different masks? That’s the real edge in crypto today-not predicting the next moonshot, but understanding how the pieces fit together.What does a correlation of 0.9 mean between Bitcoin and Ethereum?
A correlation of 0.9 means Bitcoin and Ethereum move in very similar ways-when one goes up or down, the other follows almost exactly. It doesn’t mean they rise by the same percentage, but their direction and timing are tightly linked. This suggests they’re influenced by the same market forces, like macroeconomic news or exchange outages. While this is common in bull markets, it reduces diversification benefits.
Can cryptocurrency correlation be negative?
Yes, but it’s rare. A negative correlation means when one asset rises, the other falls. For example, during the 2023 U.S. dollar rally, Bitcoin fell while Monero rose slightly due to its privacy appeal. Some stablecoins like DAI have shown weak negative correlation to BTC during extreme volatility, as traders move into stable assets. But true negative correlations (below -0.3) between major cryptos are uncommon and usually short-lived.
How often should I check crypto correlations?
Check monthly if you’re a long-term holder. If you’re actively trading, check weekly. Correlation can shift fast during news events-like Fed announcements, regulatory rulings, or exchange hacks. Don’t rely on a number from six months ago. Use tools like TradingView or CoinGecko to track changes over time.
Is correlation the same as causation?
No. Just because two cryptos move together doesn’t mean one causes the other. For example, Bitcoin and Solana might both rise because investors are bullish on crypto overall-not because Solana depends on Bitcoin. Correlation shows association, not cause. Always look at underlying reasons: network usage, tokenomics, adoption trends.
Do meme coins correlate with Bitcoin?
Yes, but inconsistently. During bull runs, meme coins like Dogecoin and Shiba Inu often correlate with Bitcoin at 0.7 or higher because retail investors buy them together. But during downturns, they can decouple-meme coins crash harder and faster. In early 2024, Dogecoin’s correlation with Bitcoin dropped to 0.4 during a Bitcoin-specific rally, showing it was no longer just riding Bitcoin’s wave.
Can I use correlation to predict future prices?
Not directly. Correlation tells you how assets moved in the past, not what they’ll do next. But it can improve predictive models. For example, combining correlation data with machine learning (like LSTM networks) improves price forecast accuracy. However, standalone correlation won’t tell you if Bitcoin will hit $100K-it only tells you how likely Ethereum is to move with it.


Comments (16)
Basil Bacor
lol u think u r so smart with all these numbers but seriously? correlation is just fancy way of saying 'everything goes up n down together'... i bought btc n eth n they both crashed same day... no shit sherlock. 🤡
Emily Pegg
i mean... i get it? but like... why are we even talking about this like it's rocket science? i just buy what i like n if it goes down, i shrug. 😅 correlation? sounds like something your finance bro says while sipping oat milk latte. we're not hedge funds, we're just people trying not to lose our pizza money.
Ethan Grace
There is a metaphysical truth here, buried beneath the statistical noise. The market, in its infinite absurdity, mirrors our collective anxiety. When BTC rises, it is not merely a price movement-it is the echo of a thousand sleepless nights, a shared hallucination of wealth. And when ETH follows? It is not correlation-it is communion. We are all one in the blockchain. We are all one in the panic.
Brian T
this whole post is just a long-winded way of saying 'don't put all your eggs in one basket'... but like, we already knew that. why do we need 10 paragraphs and a correlation matrix to tell us that? i could've just said 'don't be dumb' and saved everyone 5 minutes.
Nash Tree Service
The empirical evidence presented herein is both statistically significant and epistemologically insufficient. One must consider not merely the Pearson coefficient, but the ontological underpinnings of market behavior. The assumption that correlation implies diversification is a fallacy rooted in the Cartesian dualism of asset classes. In truth, all digital assets are merely manifestations of speculative capital, and their apparent divergence is an illusion perpetuated by algorithmic liquidity sinks.
Drago Fila
Hey, this is actually super helpful! I never thought about checking correlation before. I had like 5 coins and thought I was diversified... turns out I was just holding 5 versions of the same bet. Added XRP after reading this and wow, it really did hold up better when BTC dropped. Thanks for breaking it down so clearly! 🙌
James Burke
I think people overcomplicate this. If you own multiple cryptos and they all move together, you're not diversified. Period. Use TradingView's heatmap. It's free. Check it once a month. If everything's red, you're in trouble. Simple as that.
Bill Pommier
The assertion that correlation can be used as a portfolio management tool is not only naive but dangerously misleading. Financial markets are non-stationary systems. The very notion that a single coefficient derived from historical price data can predict future behavior ignores the fundamental chaos of market microstructure. This post reads like a textbook written by someone who has never traded during a flash crash.
Olivia Parsons
I actually use the CORREL() function in Sheets every month. It's so easy. Just copy paste daily prices from CoinGecko, plug in two columns, done. I found out my Solana and AVAX were at 0.92 last month-so I sold some AVAX and bought some DOT. It's low effort, high reward.
Austin King
This is actually really useful. I thought I was diversified but I had like 4 coins all moving together. Added one with low correlation and my portfolio didn't crash as hard last month. Small change, big difference.
Bryanna Barnett
I mean, I'm not surprised people don't understand correlation. But honestly? If you can't grasp that two assets moving in tandem aren't 'diversification', maybe you shouldn't be investing in crypto at all. Just sayin'.
Josh Moorcroft-Jones
Okay, so let me get this straight: you're telling me that if I own BTC, ETH, SOL, ADA, DOGE, and XRP, and they all have correlations above 0.8, I'm not diversified? But what if I own them in different wallets? Does that change anything? And what if I bought them on different days? Does the time-weighted average correlation matter? And what if I use a hardware wallet? Does that introduce a behavioral correlation? And what if I also own gold? And what if I bought BTC during the halving? And what if I hold ETH staking rewards? And what if I use a DCA strategy? And what if-
Bonnie Jenkins-Hodges
USA FOREVER!!! 🇺🇸 Crypto is just a scam. All of it. But if you're gonna play, at least buy Bitcoin. Everything else? Trash. Correlation? Who cares? Just buy BTC and HODL. That's the only real strategy. 🚀
Melissa Ritz
I skimmed this. Too long. Too many words. I don't need a lecture. I just want to know which coin to buy next. Can we just skip to the part where you tell me what's gonna moon?
Cerissa Kimball
Correlation is a useful tool but one must consider the volatility regime and the underlying liquidity conditions of each asset class as well as the temporal resolution of the data points used in the calculation as well as potential outliers that may skew the results and also the possibility of structural breaks in the underlying relationship due to regulatory events or technological shifts
Jamie Hoyle
Correlation is a myth. Everyone says BTC and ETH move together-except when they don't. Like in 2023 when ETH went up 120% and BTC only went up 15%. That's not correlation-that's narrative. You're all just chasing trends and calling it math. Wake up.